Calendar Years are Arbitrary
Time is a human invention. Sure, the Earth orbits to Sun every 365 days and rotates every 24 hours, but humans developed the concept of time. Whether it is dark or light outside, my alarm clock rings at 5:50am each morning. That wasn’t the case for humans two hundred years ago. They structured each day by the position of the Sun in the sky.
Einstein’s theory of general relativity proposes that time is only the same for all who are moving through space at the same rate, like those of us on Earth. If we could travel in a spaceship at almost the speed of light, time would move 10 times slower than here on Earth. Thinking about Einstein’s theory twists my brain in to knots. It literally blows my mind.
Back on Earth, humans have divided our time into days, weeks, months and years. There were other calendars, but the world has agreed to use the Julian calendar proposed by the Roman Caesar in 45 BC. We need to add a day to the calendar every four years to keep it on track with the Earth’s orbit around the Sun, hence the “leap year” phenomena. These are the calendar years we use to mark our birthdays, holidays, anniversaries, and seasons.
Naturally, investors use calendar years as a period of measurement. How did the market do last year? Most of us view our investment performance “year-to-date” meaning how the investments have changed in value since January 1. Advisors conduct annual (or quarterly) reviews comparing investment returns to benchmarks which are sometimes appropriate but often are not.
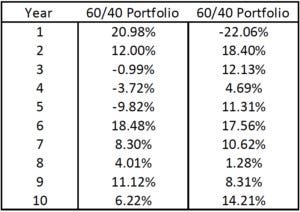
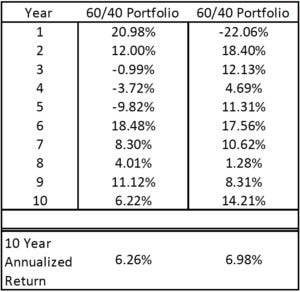
Below are two lists of annual returns for a 60/40 portfolio that is hypothetically invested 60% in the S&P 500 Index and 40% in the Bloomberg Barclays U.S. Aggregate Bond Index. I’ve removed the calendar years on purpose. Take a look at the series of returns and try to imagine experiencing them in succession.

In the first column, performance starts strong with two double digit returns in a row. The next three years are all negative, first down less than -1%, then down another -3.72%, and down almost -10% the final year. That was probably a rough time to stay invested, watching your portfolio decline in value three years in a row. The sixth year has a strong rebound, and the final four years are smooth sailing with returns ranging from 4-11%.
The second column begins with an abrupt decline of nearly one-fourth of the portfolio. Yikes. There are two strong rebound years of double-digit growth followed by a range of positive returns. The dramatic decline in year 1, was the only down year in this decade.
How do the returns of these two 10-year periods compare? The second column had a higher return but both were between 6%-7% a year on average.

Which return matters to an investor who is saving for or already funding their retirement? Financial planners estimate an average annual return over a full market cycle to determine if the plan is on track. The calendar years are arbitrary. They are convenient marking periods but provide little information about investor success.
I tell clients to expect to earn the average return in their financial plan through a series of up and down years. Much like the two decades displayed above, returns are typically much higher than the average or are negative.
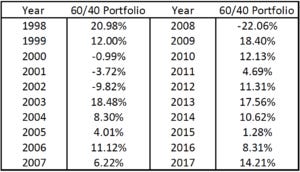
Here are the calendar years corresponding to the two 10-year periods. It’s the last 20 calendar years broken in to two sets of data.

Do you remember what your portfolio’s return in 2002? How about 2012? Do you even care about those numbers anymore? You probably don’t if you stayed invested. These numbers are good reference points, but it is important stay focused on the bigger picture.
The post Calendar Years are Arbitrary appeared first on The Belle Curve.


