

Watching Paint Dry

Last week, a client pointed out to me that the market is in the same place it was 18 months ago. I nodded my head. Of course, that happens all the time. But each time, we feel the emotional malaise that comes with watching our accounts hover around the same value for a year and a half. Investing is often like watching paint dry. You don’t actually see it happen, but eventually the paint dries.
Keeping in mind that a globally diversified portfolio includes many other asset classes, I pulled the historical 18-month rolling returns for the S&P 500 Index. Since January 1926, there have been 1,104 rolling 18-month return periods for the index. The average 18-month return was 11.6%, while the highest return was 83.9% (Dec 1933) and the lowest -55.3% (May 1932). Almost 21% of the time, 18-month rolling returns were negative, and 27% of the time returns were less than 4% – essentially flat without dividends. These are annualized returns.
Since the Great Depression may have skewed the numbers, I looked at the 18-month rolling returns since January 1945. There were 893 return periods in that data set. The average return was 12.2%, with a high of 47.4% (July 1955), and a low of -35.6% (February 2009). Returns were negative 16% of the time, and returns were below 4% in 24% of the 18-month periods.
My takeaway is that about one out of every four 18-month time-periods will be flat or negative for the U.S. stock market. Let’s take a look of some of the recent examples.
Here is where we are today. The S&P 500 ended May around the same level is began the year in 2018. While this might feel like watching paint dry, there was a lot of volatility during this time. From January 1, 2018 to September 20, 2018, the index was up 8.99%. This included a dramatic 10% drop in the market in early February. Between September 30 and Christmas Eve, the index was down -19.3%. Since then, the index is up 17.25%. So yes, we ended up near January 2018 levels but took a wild ride along the way.

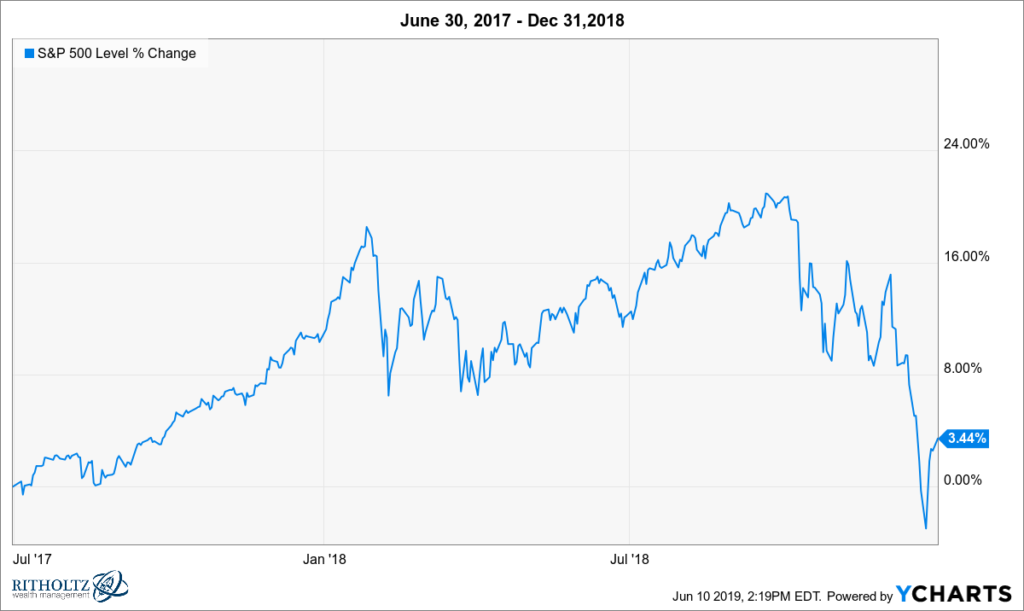
Speaking of last fall’s volatility, we ended 2018 at almost the same spot we were back in June 2017. This is despite being up 20% on September 30, 2018. You can see the 10% decline in early February 2018 pretty clearly on this chart.
Do you remember the 18-month period between August 2014 and February 2016? A dollar invested in the S&P 500 Index lost -3.55% during that time.

And yet, despite all three of these treading water moments, the index is up almost 38% since August 2014. How quickly we forget the goldilocks year of 2017, when the S&P 500 Index was up 19.42% and hardly declined by more than 1% during the entire year.

Analyzing investment performance depends a lot on the beginning and end date you choose. We all have a tendency to anchor our portfolio’s highest value as a marker for future performance. Sometimes it take months or years to overcome the next all-time high mark. And once an investor starts taking withdrawals, new high water marks are no longer the goal.
Here is the ultimate watching paint dry example. After 20 years, Apple’s stock price landed in basically the same spot.
Closing price for Apple:
April 21, 1983: $52.00
April 21, 2003: $52.56
(This is in 1983 shares. Shares in today's terms have split 56:1)— Eddy Elfenbein (@EddyElfenbein) June 10, 2019
Long-term investing is both boring and thrilling at the same time. We take long rides that seem to go nowhere only to hit a new stride out of the blue. This can be maddeningly frustrating, especially when a lifetime of savings is at play. None of us have a crystal ball, and trying to time the ups and downs of the market lends itself to two opportunities to be wrong.
There’s a saying in Texas – if you don’t like the weather just wait a little while. That is a good suggestion for long-term investors as well. If you don’t like your returns, just wait a little while. Sometimes ‘a little while’ takes a few years, but the magic of being invested in the market over years, decades, and your lifetime tends to pay off in spades.
If you haven’t seen Josh’s video about compounding returns on CNBC, I highly recommend you watch it.
The post Watching Paint Dry appeared first on The Belle Curve.