

Every Single Time

Stocks can go down? How quickly we forget. I am amazed to see investors get spooked every single time.
Stocks typically selloff roughly 7-10% at least once a year. A few months later, we’ve forgotten the reason for the selloff because markets recover and move on to new highs. The graph below shows the largest intra-year decline for the S&P 500 Index versus the calendar year return. In most years, stocks finish higher. Also in most years, there are decent sized selloffs.
In 2020, stocks were down 34% and finished the year up 16%. That was an historic reversal, but the theme is not as rare as you might imagine. In 2019, stocks declined 7% at one point and finished the year up 29%. In 2016, down 11% to up 10%, in 2014, down 7% to up 11%.

Source: J.P. Morgan Asset Management Guide to the Markets
I like to make fun of ridiculous financial market headlines. Yesterday I saw “Stocks have worst day since ….. January”. Holy cow! The worst single day for stocks in four months? Dramatization wins eyeballs, and more eyeballs lead to more advertising dollars. Never forget that media is a business. The S&P 500 Index is less than 4% from all-times highs and is up over 40% since this time last year, and we are supposed to be worried about a 4% decline? Have we already forgotten that day in March last year when stocks were down 13% in one day? I wanted to throw up that day, but instead I wrote a post encouraging investors to deploy cash on the sidelines.
No matter how many times I beat the drum that media consumption is detrimental to financial health, investors fall prey to the entertainment of fear. I get it. It’s human nature. Watching a portfolio decline in value is scary, every single time.
This week, investors are worried about inflation. Last year, it was global pandemic shutting down businesses and schools. Before that it was trade wars, the Taper Tantrum, the downgrade of the U.S. credit rating, a subprime mortgage crisis rippling across the global financial system, the bursting of the dot.com bubble. Should I go on? There will always be another crisis.
But since inflation is the topic of the day, let’s address it. Prices are up 4.2% over the last 12 months. That’s not insignificant. Since the end of the financial crisis, the Fed has struggled to get inflation ABOVE its benchmark of 2% per year. Price increases aren’t shocking either. The pandemic shut downs have created a combination of supply shortages and pent up demand. Throw in a massive amount of fiscal stimulus, and there are a lot of dollars floating around chasing an limited supply of post-pandemic opportunities. There will be two Jazz Fests in New Orleans in the next 12 months; one in October and another next spring. We are making up for lost time.
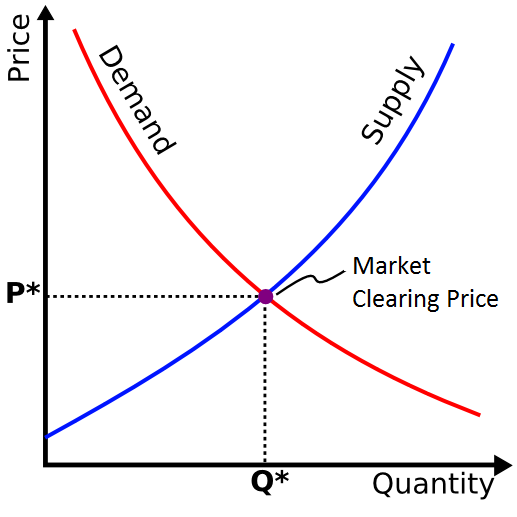
In microeconomics 101, the first principle is that price is the intersection of the supply curve and the demand curve. More demand = more supply or higher prices. Supply can take time to catch up, so prices rise in the meantime. Demand is outstripping supply right now, so it makes sense that prices are going up.

You can see this in the labor market. The hospitality industry needs to hire a TON of workers this summer. In normal times, many of these jobs are filled by temporary workers from overseas. Restrictions on international travel make that impossible this year. Now there is a shortage of labor. Employers are forced to raise wages (the price of labor) to find people willing to do the jobs. Price is the self correcting mechanism of free markets. It’s fun to watch this happening to wages, which have painfully lagged inflation for decades.
So allow me to summarize my thoughts here. Stocks selloff regularly. Selloffs are a feature of investing, not a bug. Inflation isn’t as scary as it sounds, yet. In fact, inflation may end being a good thing if it causes wages to go up. But none of this reasoning can eliminate the fear we feel when the value of our portfolios decline. It happens every single time.
The post Every Single Time appeared first on The Belle Curve.