

For How Long?

As the coronavirus drags in to its third month, many are asking – how long will it last? How long will we be working from home? How long will schools be closed? How long until large events can resume? Waiting for something with an unknown end date is maddening. It might be easier to wait two years with a known end date, than 12 months with uncertainty.
Uncertainty is a feature of investing. We can use data and evidence to determine reasonable expectations for returns, but we never know exactly when we will earn them. Sometimes investing is like watching paint dry. Returns are sideways for months or years on end. Then we have major volatile events like the historical moves we witnessed this March and April. Both the largest up days and the largest down days for the market cluster around these volatile events. The market does a whole lot of nothing, and then it explodes.
Over the long-run, stock markets have averaged between 8-10% per year. This happens by stocks being up double digits some years and negative in others. The long-term average return is seldom seen over a 12-month period. Our brains, hard wired to identify patterns where there are none, often do somersaults trying to figure out where the market is headed next.
Switching gears midway can cause problems like buying high or selling low. Although painful, the best course is often the boring old adage to ‘ride it out’.
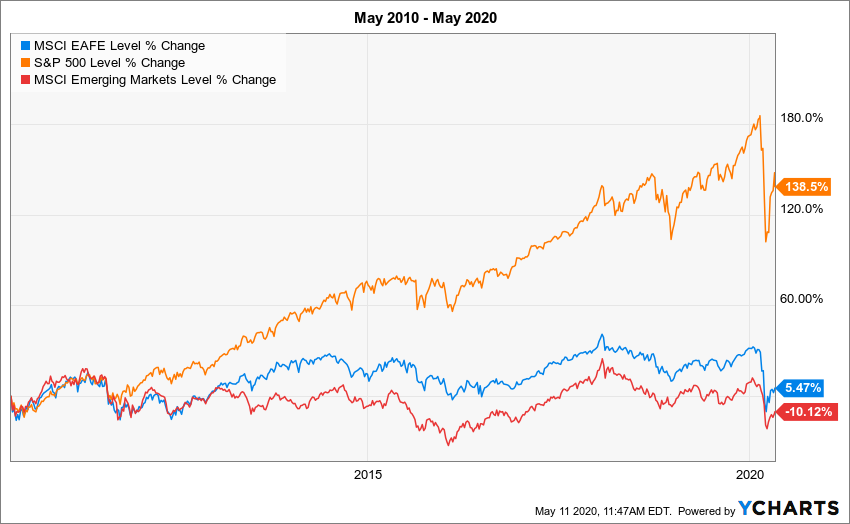
Diversification is an investor’s best friend but also, often a source of regret. There is always something that underperforms. Lately, for globally diversified investors, that investment has been international and emerging market equities.
For the past decade, stocks outside the U.S. have underperformed. Ten years is a very long time to watch an investment underperform. In ten years, a child will transition from helpless baby to a fourth grader learning long division. Why on Earth would an investor wait this long? When does one throw in the towel and admit defeat?
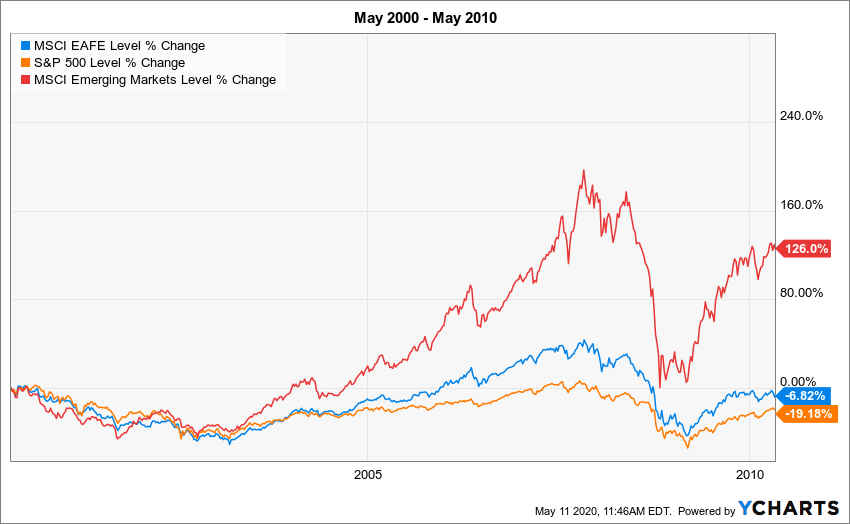
Let’s take a look at the decade prior, from May 2000 to May 2010. We see the exact opposite scenario. Emerging markets were the top performer, and the U.S. was in last place. Take a look at the chart below. Do you think that after this decade of performance, you would want to put your entire portfolio in the orange line? That orange line is the S&P 500 Index, and it’s exactly what you should have bought for the next ten years.
For how long will international and emerging markets trail stocks in the U.S.? The answer is simple; sometime between tomorrow and forever. That’s the quandary for long-term investors. No news story will tips us off, and there is unlikely to be a catalyst that signals a reversion to the mean. By the time the coast is clear, and emerging markets no longer seem risky, the return opportunity will be gone.
The best time to buy an investment is also the most uncomfortable time to do so. This is true when considering stocks versus bonds, growth versus value, large versus small, or international versus U.S. The good news that diversification (owning all asset classes in appropriate proportion) allows an investor not to miss out on the best asset class. The trade-off is having to participate in the worst performing asset class.
Until then, we wait. We wait, potentially for a very long time, with no predetermined end date. This lack of control is what drives investors mad. Hindsight is 20-20 and the news of the day is noise.
The post For How Long? appeared first on The Belle Curve.